
SOFTWARE AND DATA ANALYSIS
See the whole system at a glance
SmartAkva organises data by unit (fish group or department) and by process step (biofilter, degasser, drum filter, fish tank), with colour-coded status indicators so operators can immediately see which tanks need attention without digging through raw numbers.
Look back, compare, and spot trends
A single snapshot rarely tells the whole story. Real insight comes from seeing how performance develops over time.
-
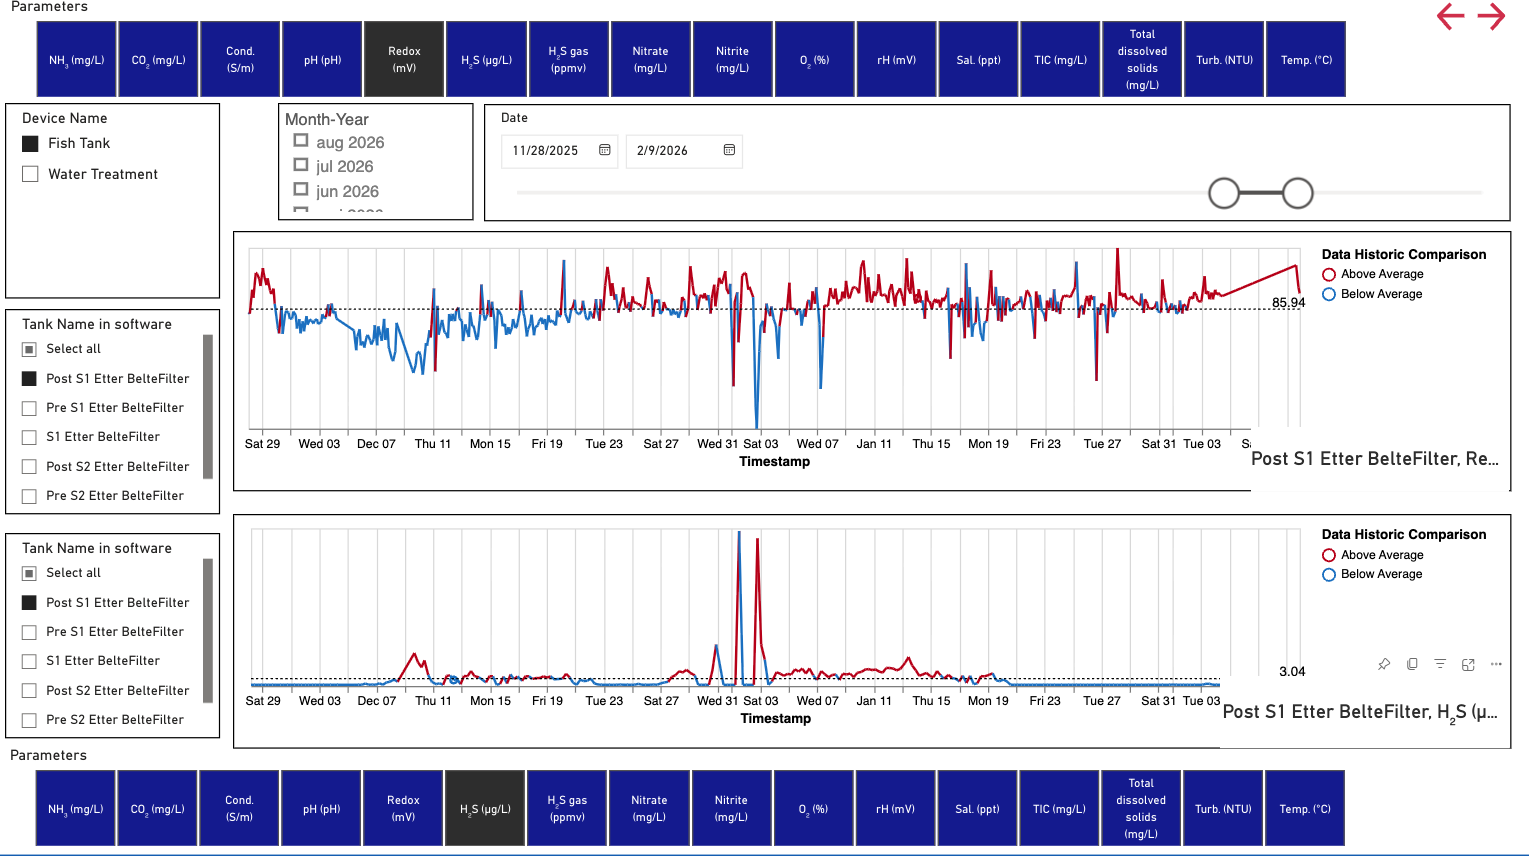
Historic data views to review how any tank or system has performed over a chosen date range, with flexible month and date filtering
Table data for detailed, exportable readings
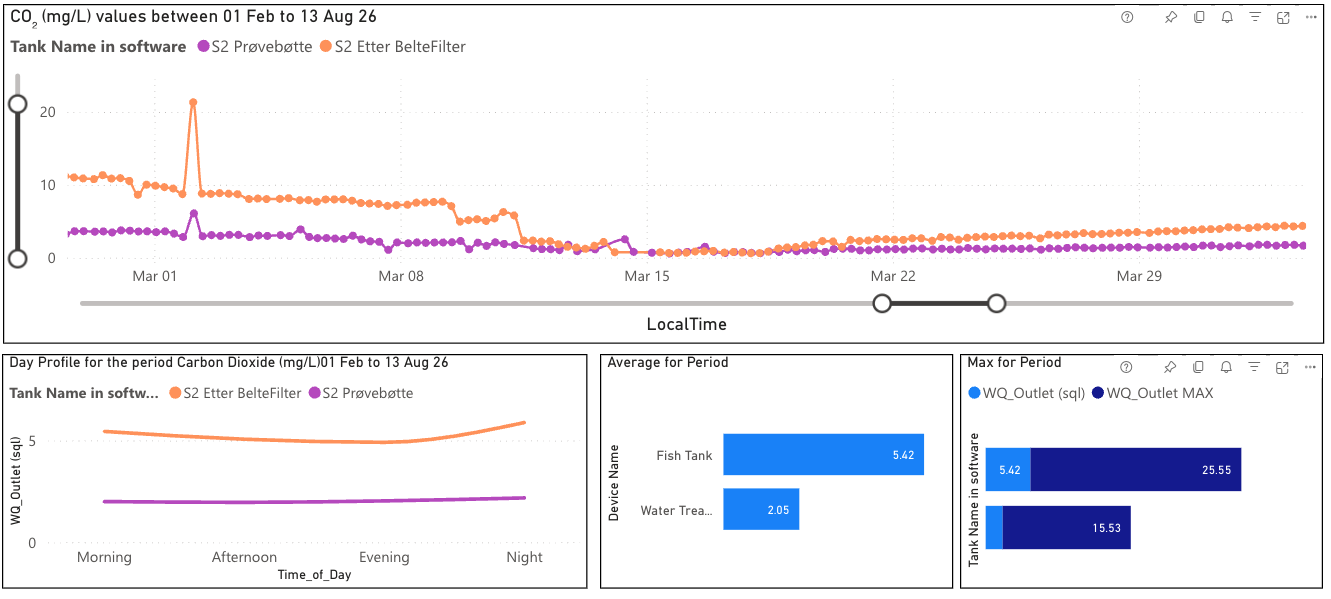
System gradient and gradient comparison tools to compare performance across tanks, systems, or production batches
Cross-parameter comparison — overlay several water parameters (for example CO2 against pH) on the same timeline to spot correlations and diagnose issues faster
Multi-tank selection to compare historic trends across several tanks at once, all in one chart
AI Analysis — built-in AI-assisted analysis to help surface patterns and anomalies in water quality data
Together, these tools turn raw readings into a clearer picture of how your production is really performing, helping you catch what matters before it becomes a problem.
ONGOING INNOVATION
Connect data from biology and environment
SmartAkva will allow you to connect biological data to environmental data and investigate the cause and effect to help you understand the performance of the fish.
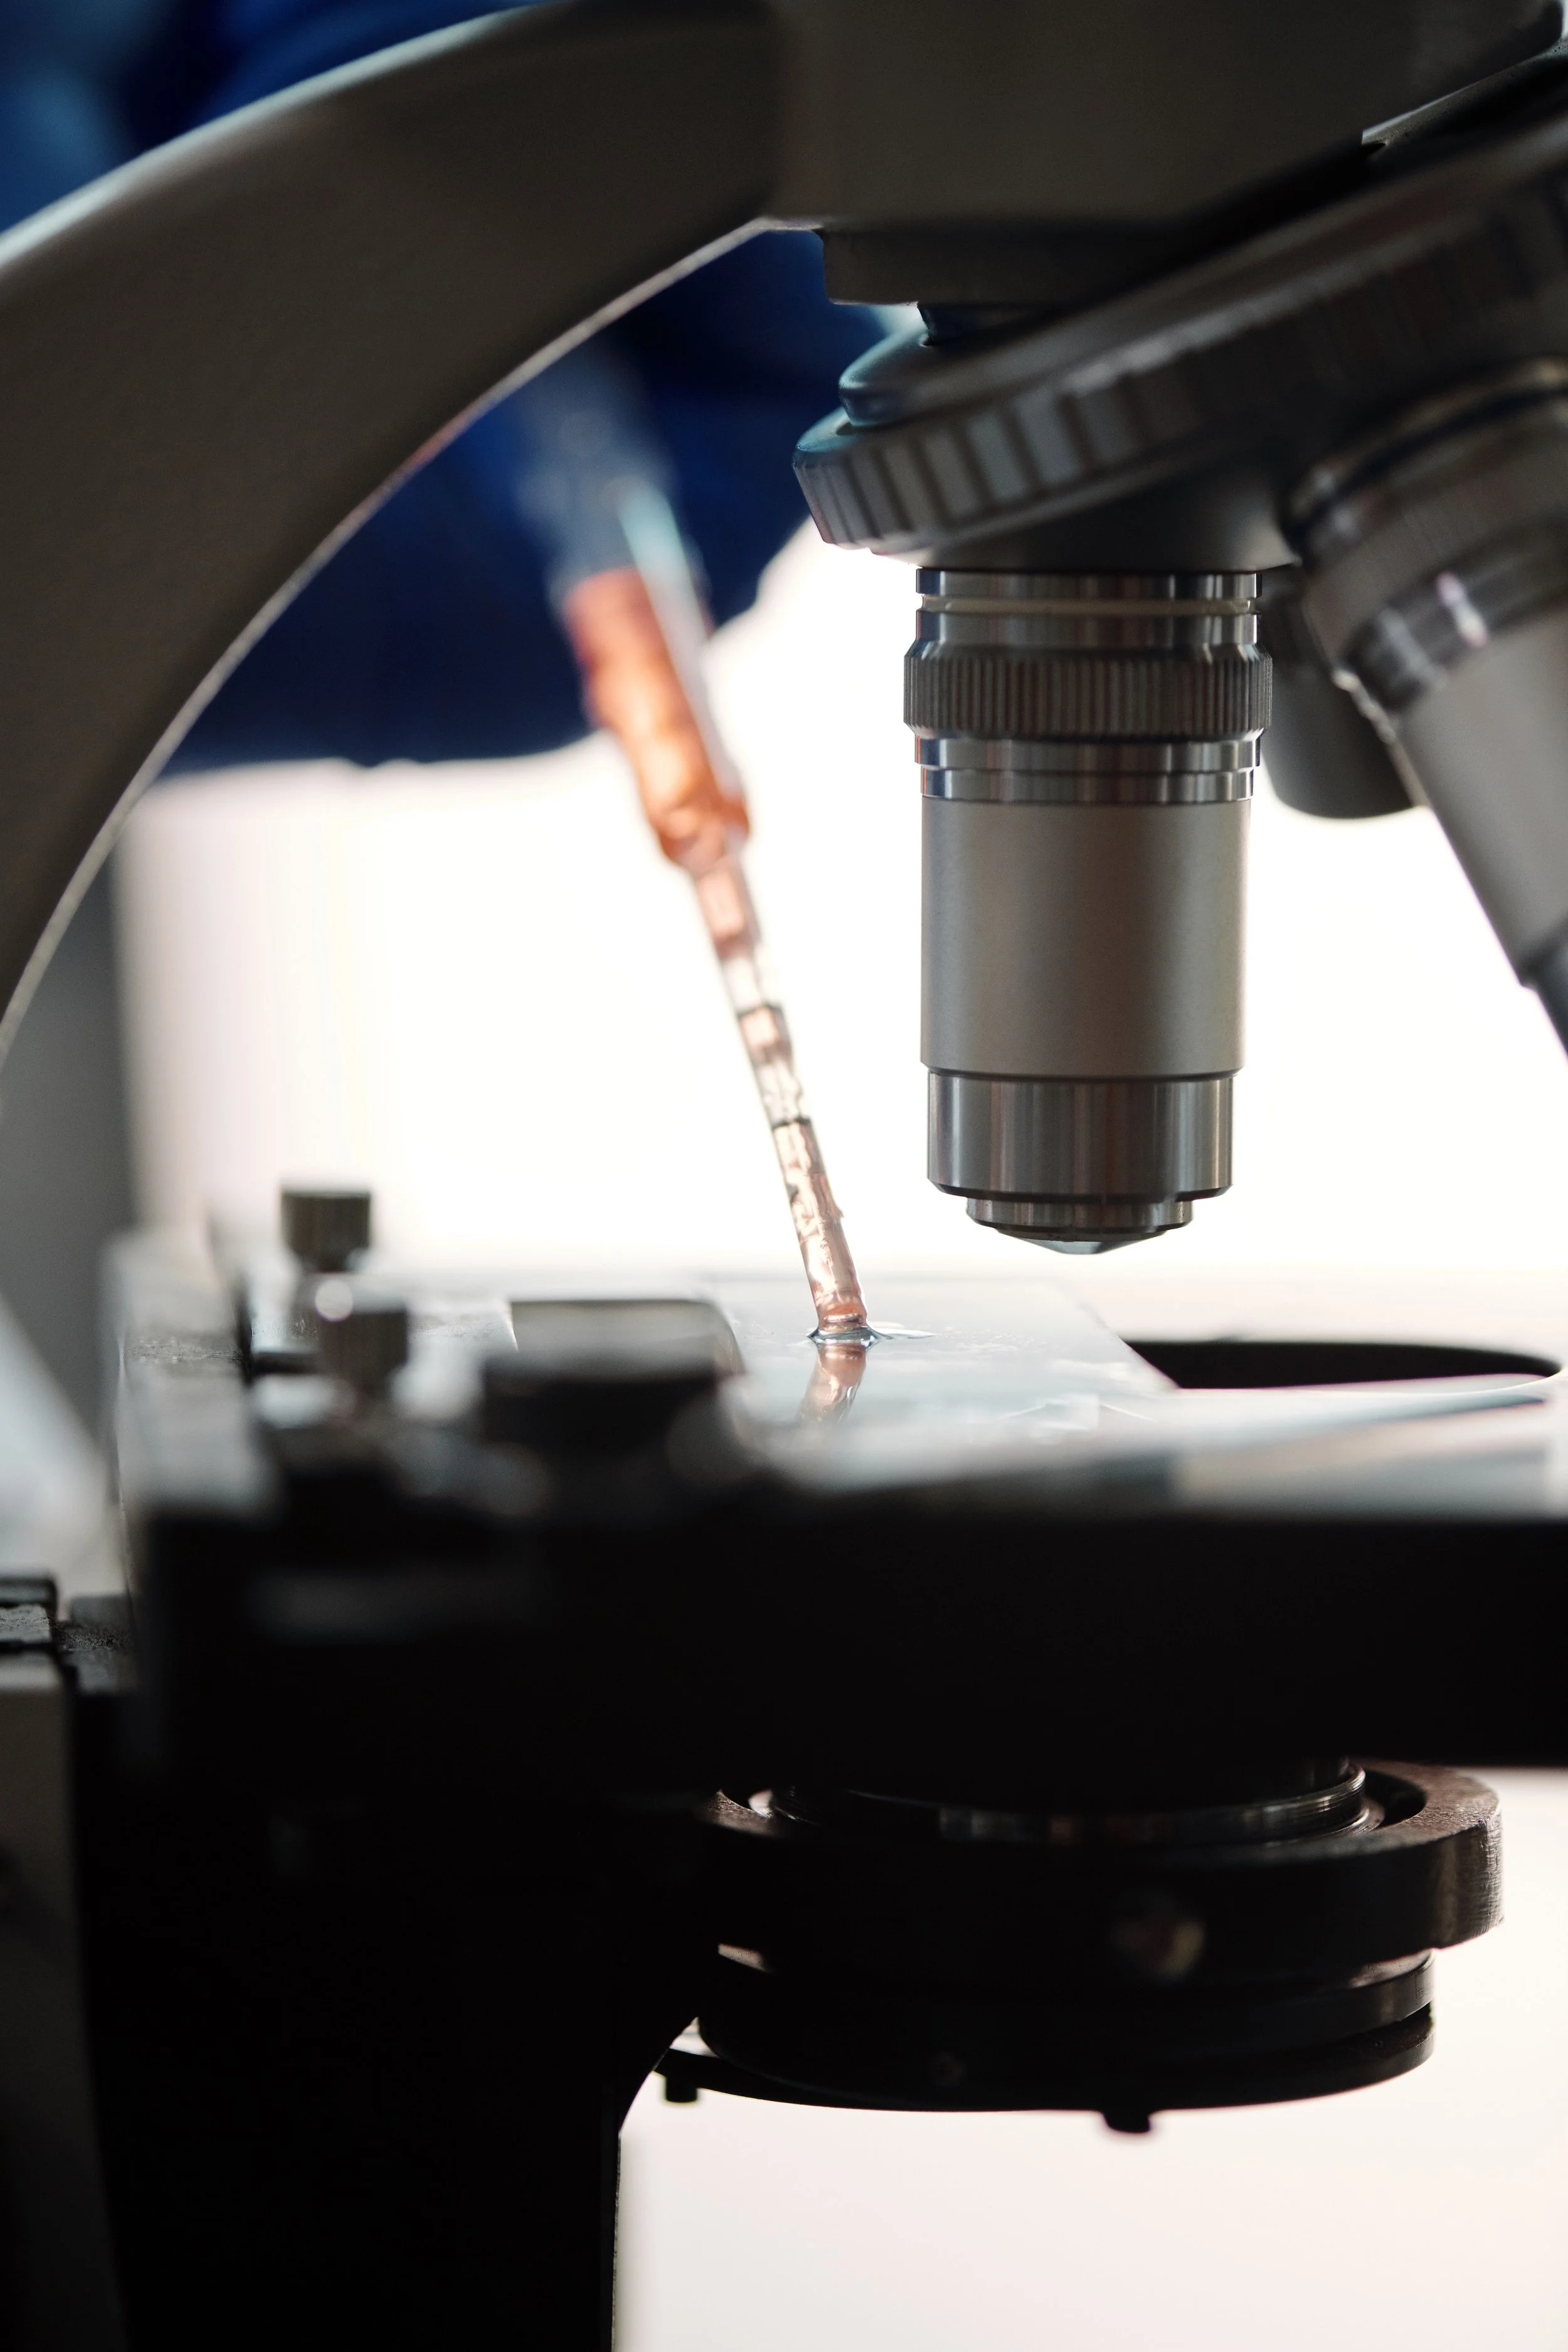
We are building a digital research lab where you can dig into the data material and work out new knowledge about your production facility.
Define your own KPI reports
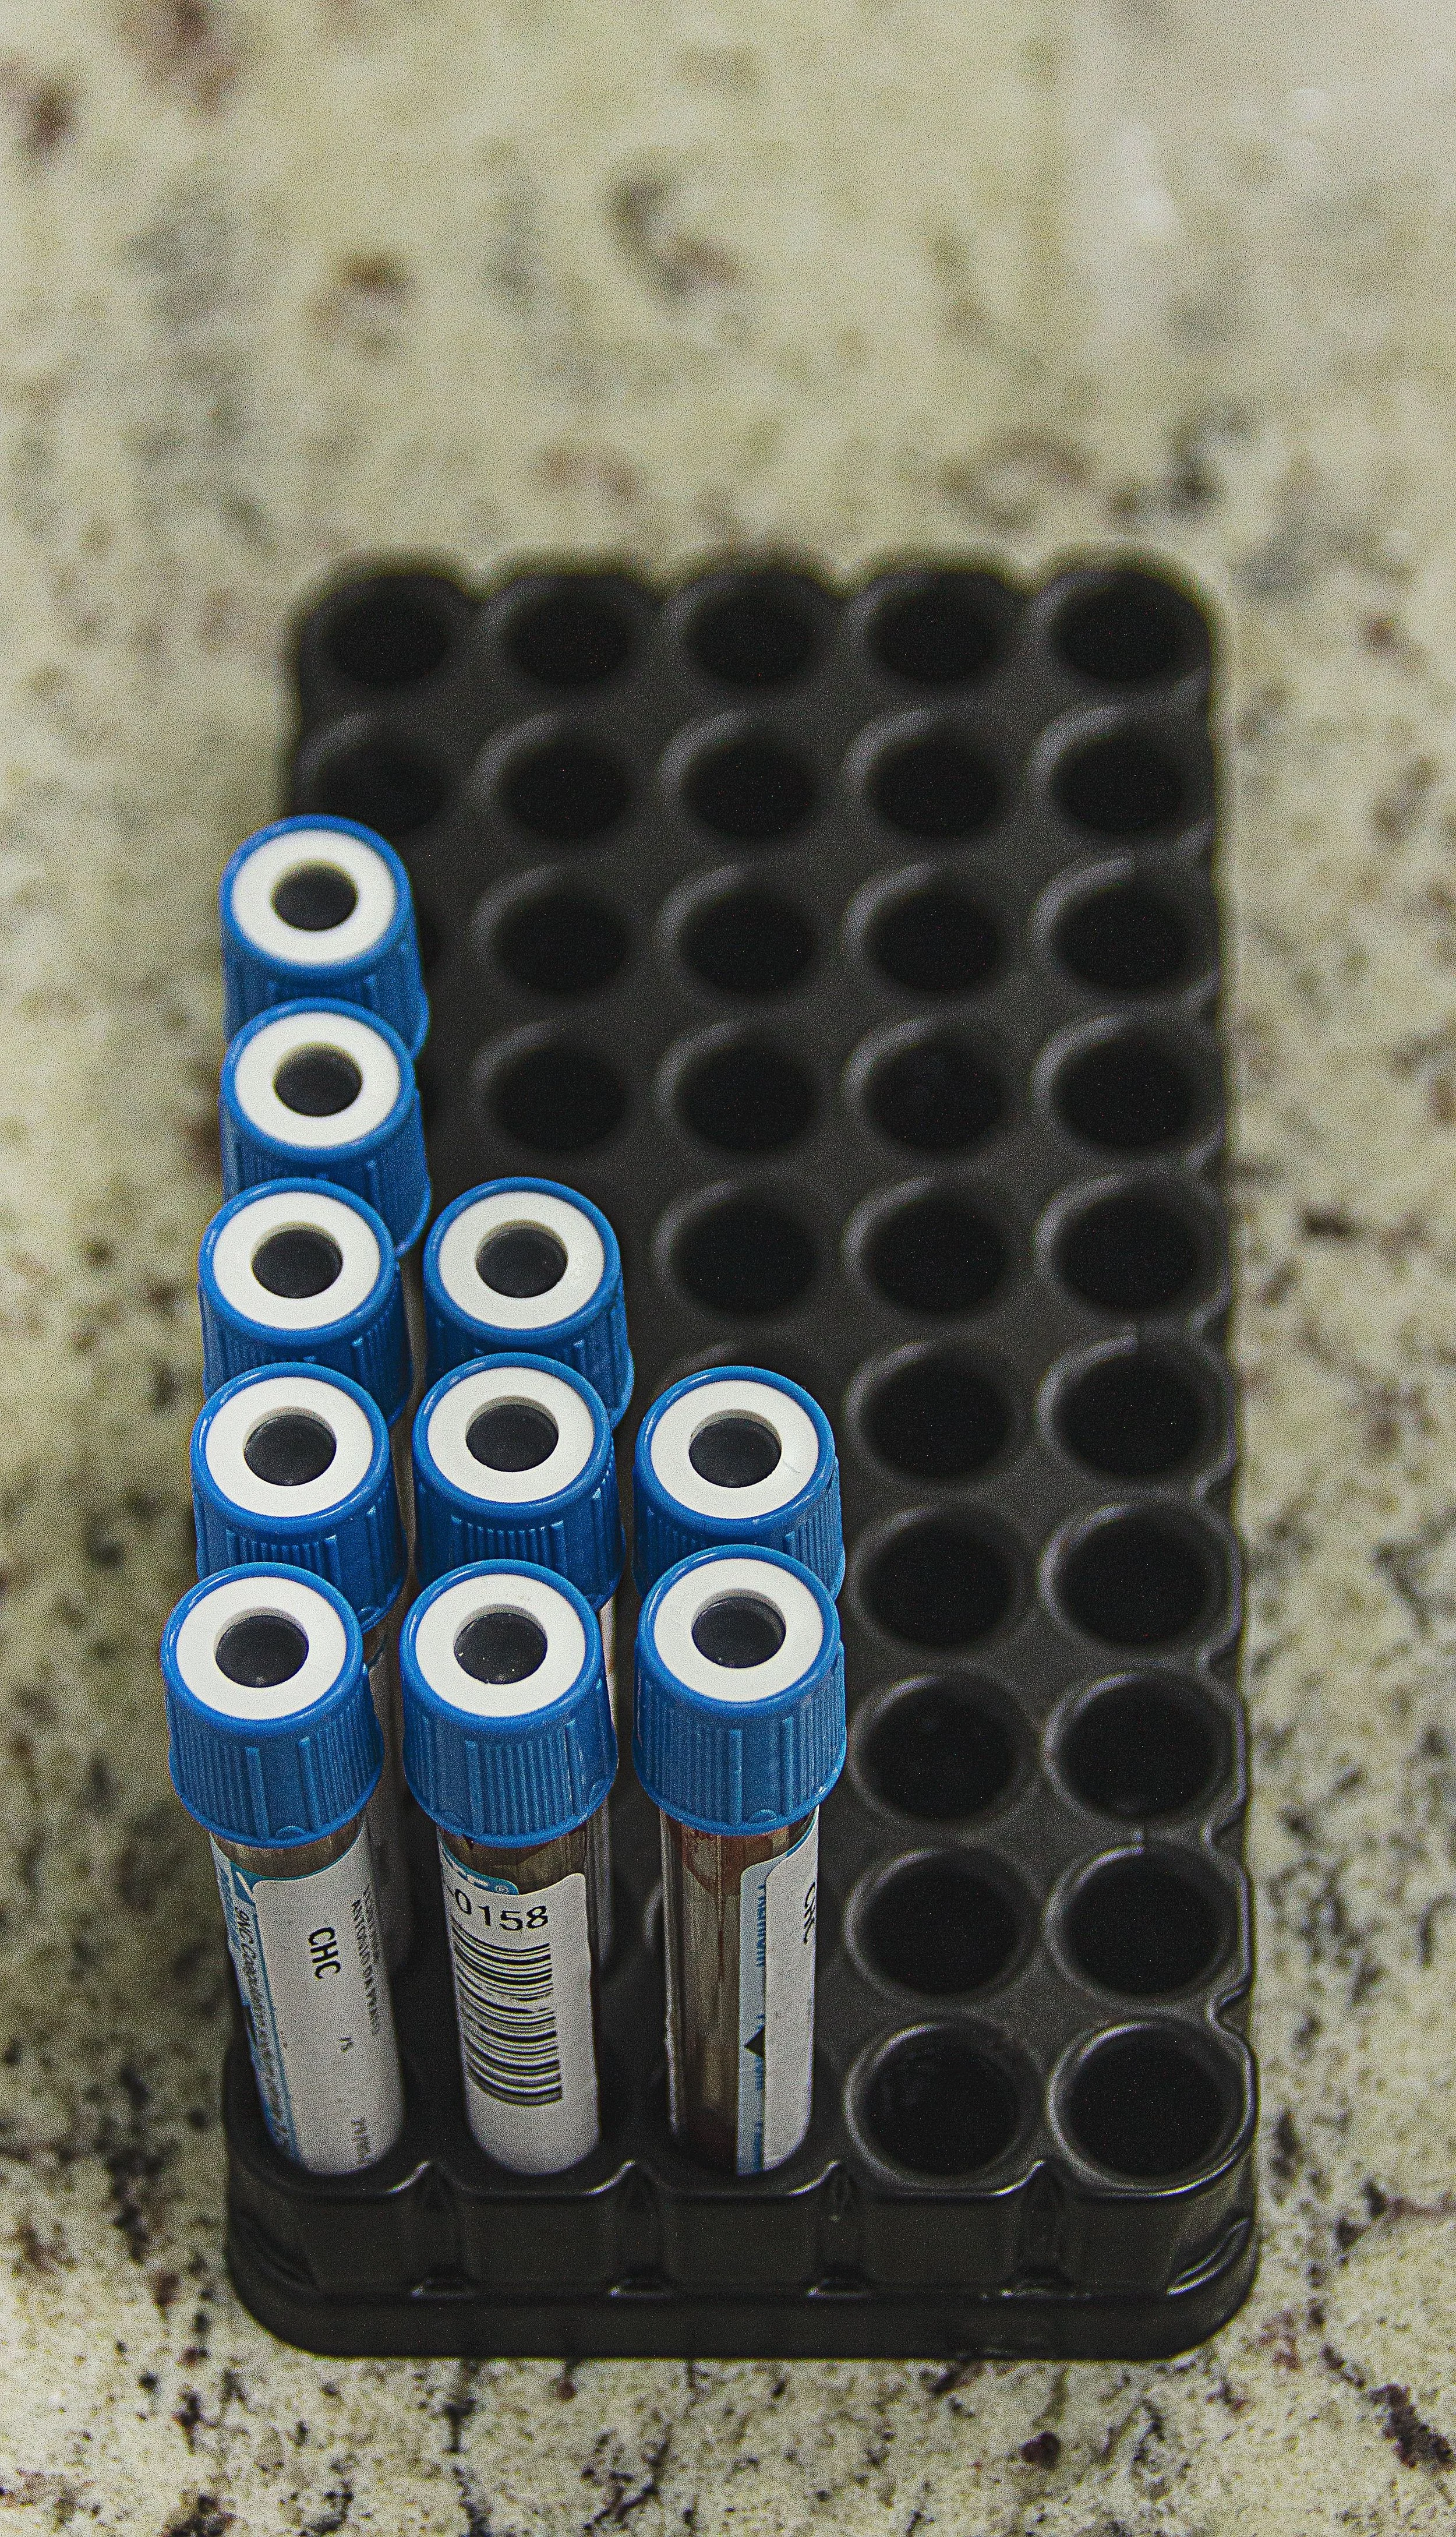
SmartAkva software will allow you to define your own Key Performance Indicators to monitor your farm’s most critical parameters and other relevant trends.
Do you want to be a part of this development? Curious? Get in touch!