
PRODUCTS
Water quality and microbial monitoring
SmartAkva combines real-time water chemistry monitoring with microbial insight, giving you a complete picture of your farm's environment.
PRODUCT
Blue Unit Lab Station - Real time monitoring of 15 water quality parameters
Blue Unit Lab Station enables deep insight in the complex dynamics in your farm. The Lab Station is an automatic water quality analysator and provides continuously insight at four essential levels;
15 water quality parameters autonomously measured several times pr day
Each fish tank are monitored continuously and identical
removal efficiency on each component in the RAS loop
short and long term trends, connections between parameters, cause and effect
The water quality in the fish farm is not stable over time and specific events might in worst case cause instant fatality for your fish group
Your RAS, decoded in real time
-
receive + 2000 data on a daily basis.
replace time consuming, slow responsive and expensive lab analysis of water quality samples
discover in advance formation of H2S
discover in advance pH drops in the fish tanks that might cause disturbance in the complex water chemistry
discover malfunction in water treatment components, for example in drum filter or biofilter.
Stay connected to your farm 24/7
reduce the risk for unexpected events
engage with external expert team to solve complex issues
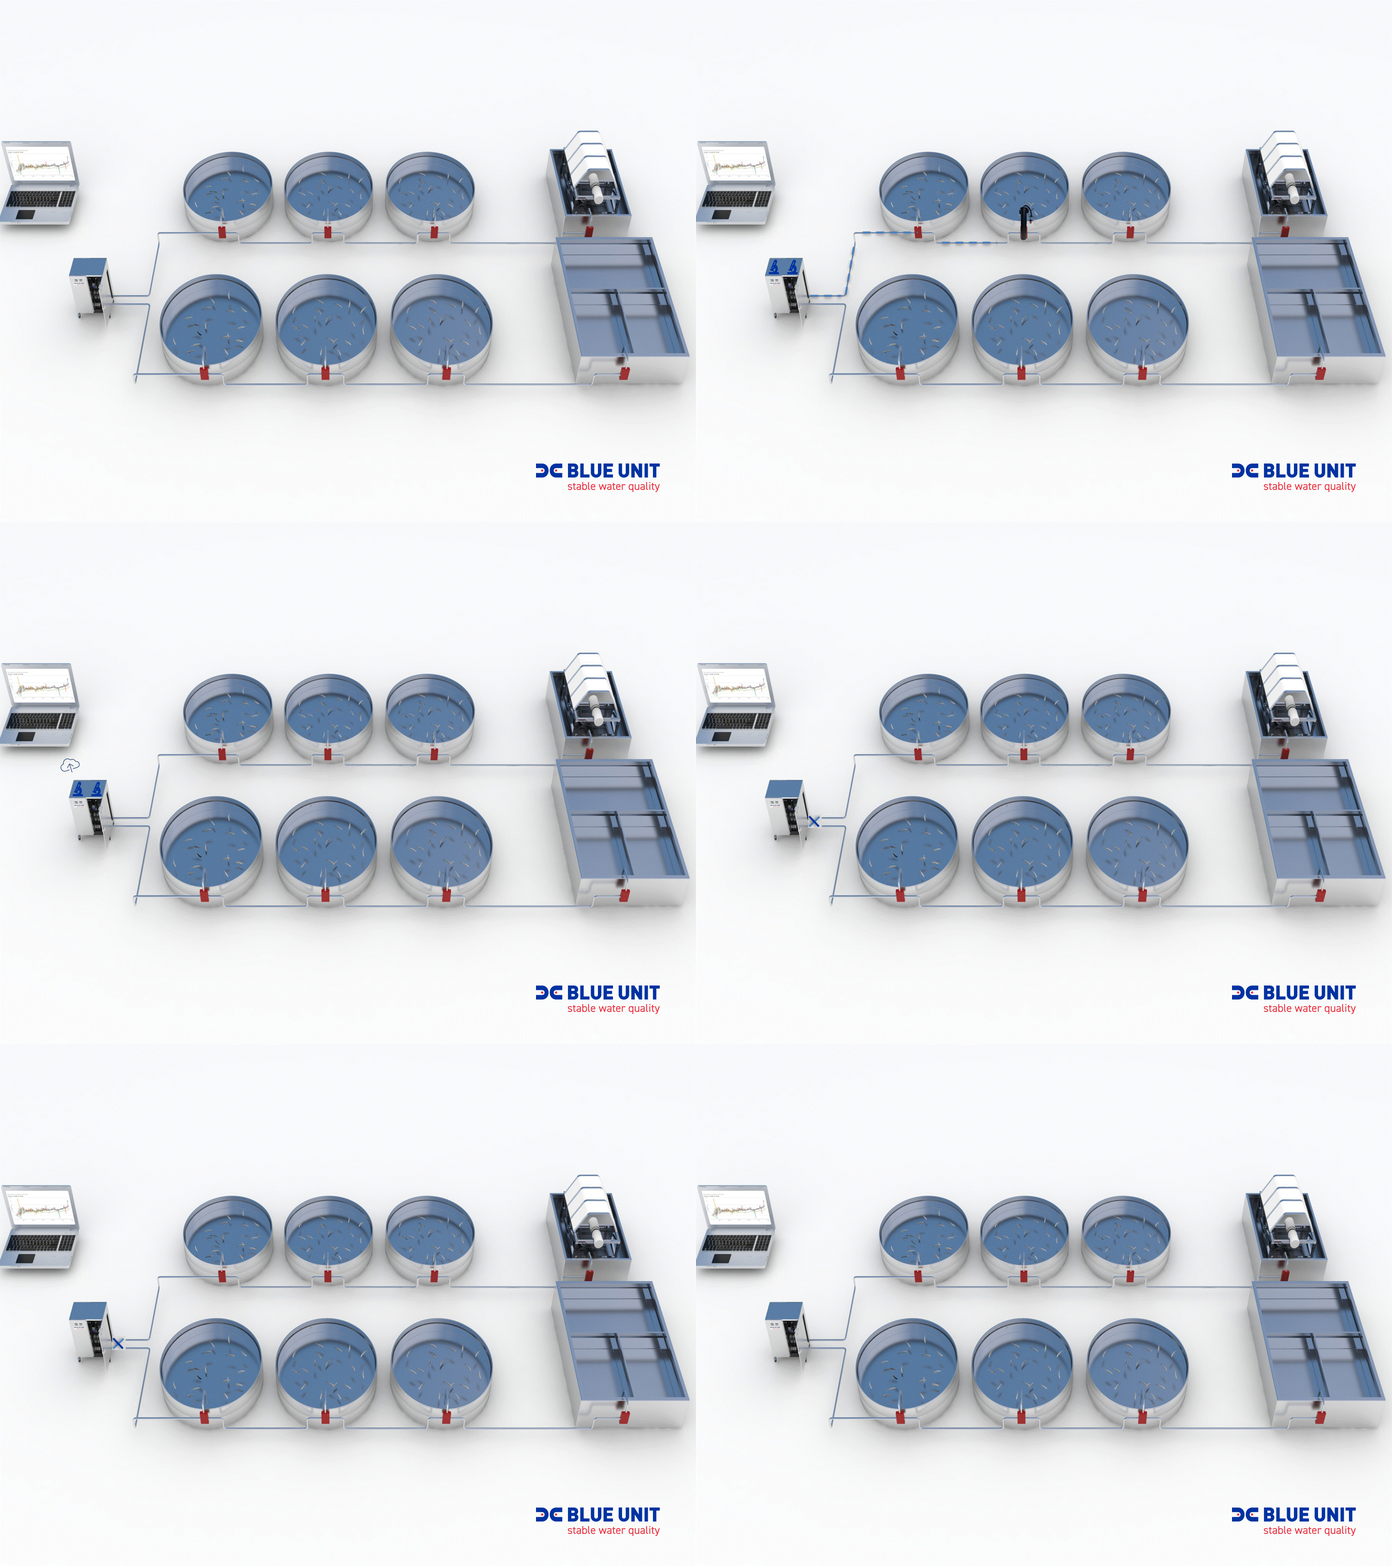
Blue Unit’s innovative hardware design results from years of development and testing. The system is based on a central cabinet containing 15 different sensors. For each sampling point, a pump is pushing a water sample in tubes connected to the cabinet.
By measuring up to 24 different locations around a fish farm with a central set of sensors, the Blue Unit Lab Station can detect changes within the RAS farm that traditional sensors might miss. This system can in addition identify gradients across water treatment machines and report any disturbance or deviations in the operational efficiency of the system.
The product
-
A central set of sensors measure up to 15 water parameters in defined order
All data is logged and loaded online to software that presents real time data, deviations and defined KPI’s. The data can be integrated with other useful fish farm data.
Following a measurement, all tubes and sensor heads are rinsed and purged of old sample water.
The next sampling interval begins, but this time new sample points. The sequence continues automatically through all the sampling points, 24/7.
The Lab Station automatically cleans all tubes and sensor heads to secure no biofilm build-up.
-
The processing of data makes it possible to provide our customers with an early warning whenever a change in water chemistry occurs.
The visualization of the data can show where, when and why there is a change in water chemistry.
The data platform provides opportunities for the customer to benchmark own performance to others anonymously.
Compared to other operational data on the farm it may help the customer to focus and manage design issues.
-
The Blue Unit Lab Station is fully automatic and does not require manual handling on a daily basis. Management of the system is done monthly by calibrating some of the sensors and general maintenance of the system.
The data is presented in the Blue Unit software and app.
On a subscription basis, we offer to visualize your data and analyse the information generated from your Lab Station. Our expert team will contribute to connect your water quality data to the fish biology and best practice methods to improve your fish farm profitability.
Our SaaS services are defined into three levels:
Software as a service
-
Fish group batch certificate
Water management meetings
Service technician visit
Visualisation of early warning
-
Basic support
Training on how to use data platform
Reduce risk by Blue Unit data monitoring
Visualization of early warning
Voucher – Free Water Quality Meetings
-
Basic visualization software
Cloud Based Solution
Free Software update
Security – Backup for all your data
Lab Station function check
License for two users
Alarm set up
The Lab Station is available in different versions
-
The original Lab Station centralised Laboratory system with 4 to 24 sampling points. Automatically measures the most important water quality parameters 24/7.
-
Compact Lab Station centralised Laboratory system with 2 sampling points. Automatically measures the most important water quality parameters 24/7.
-
Centralised Laboratory without Sampling system
-
Measuring water quality in your Wellboat
-
Monitoring your emissions from different types of industry
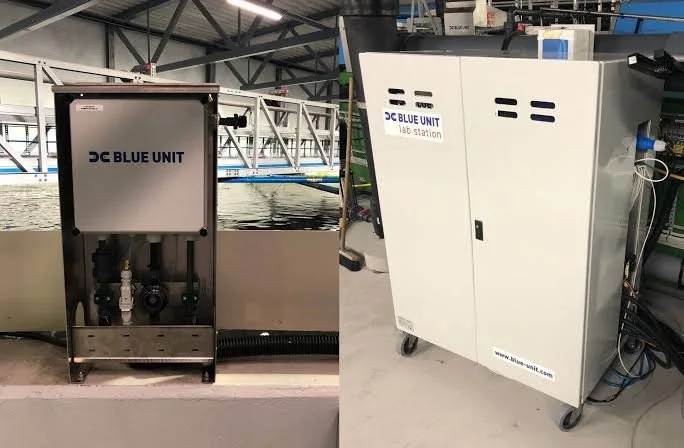
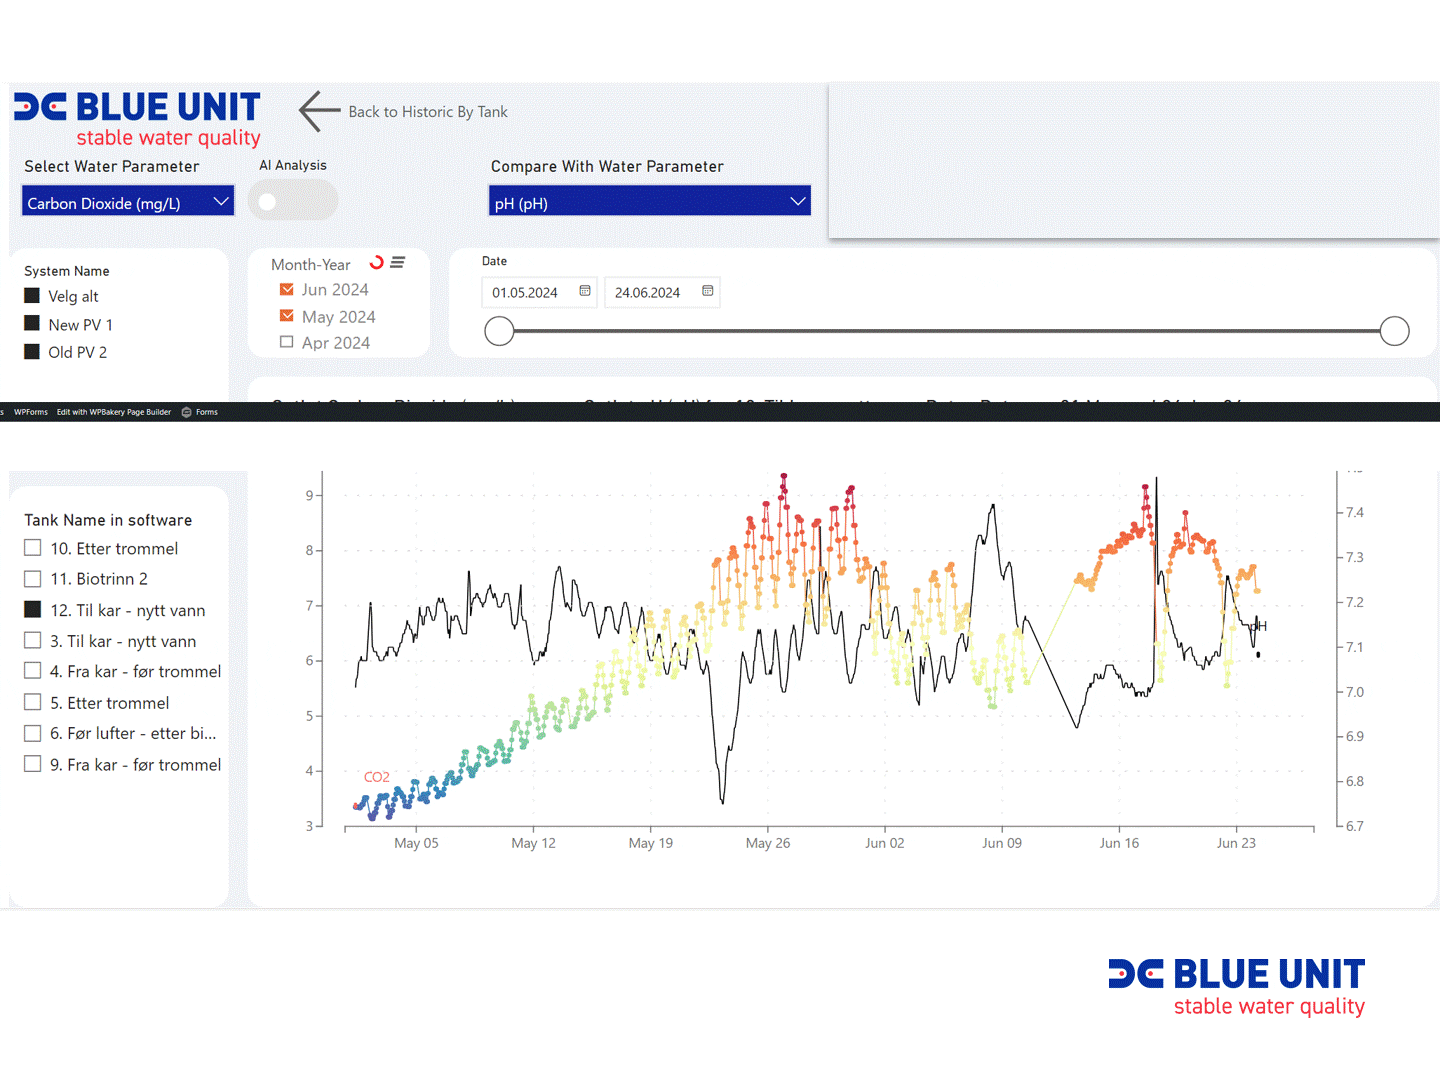
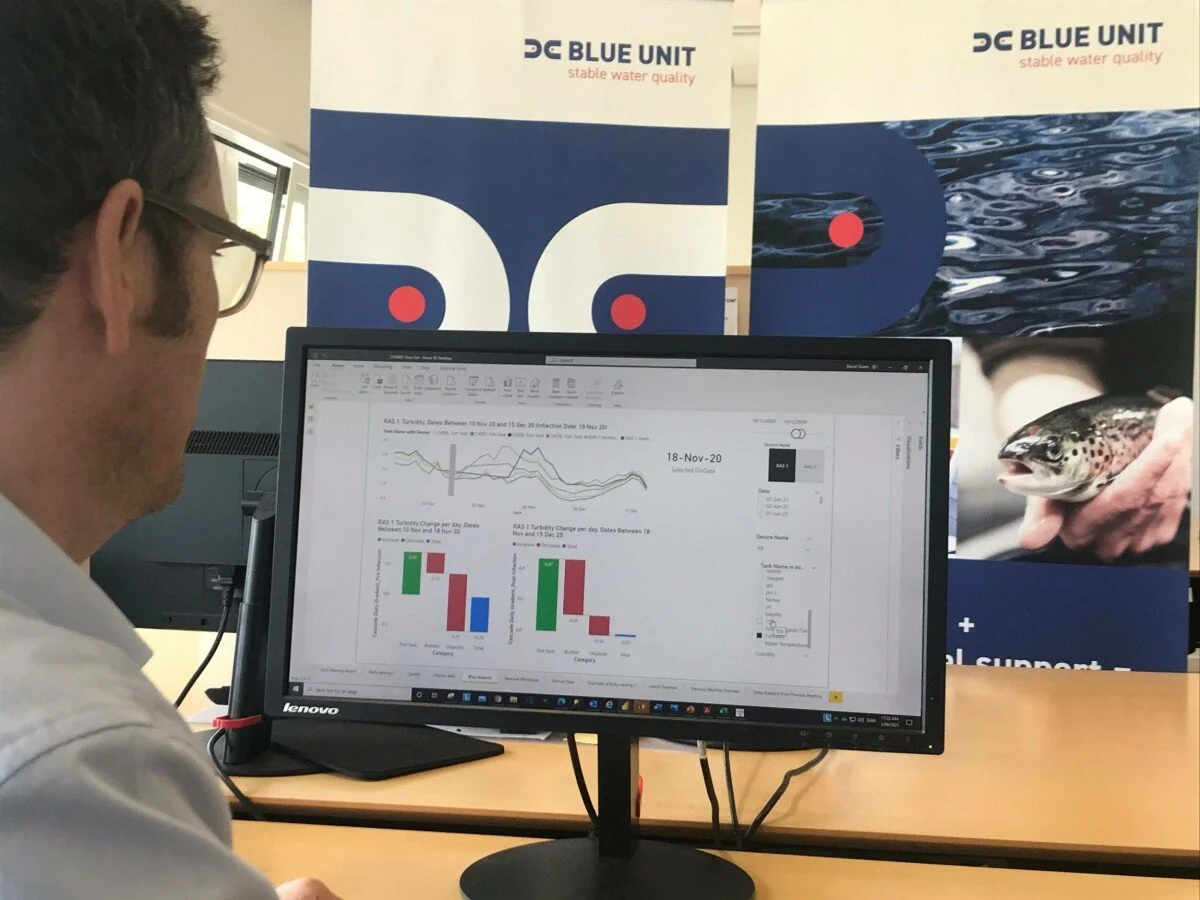
The Blue Unit Solution contains: a measurement system (lab station), data platform, and customer counselling.
More than just hardware
PRODUCT
Kytos - microbial monitoring as a service
Get your instant health inspection of your farm at one glance!
The microbial community in landbased aquaculture systems is described as the balance between two groups; the useful organisms that is involved with degradation of compounds released form the fish - and organisms that are potential harmful and a source to unwanted events.
The balance between these two competing groups are important to monitor, as inbalance is clear signal that your farm is de-stabilised.
Kytos provides fast, inexpensive and precise diagnostics that allows you to monitor the microbial community without using expensive and slow lab-analytics. A 1 ml water sample and a shipment is all that is needed - the data is sent directly to your app with clear visualised KPI’s.
-
monitor microbial community in tank water, biofilter and fish gut
monitor development of specific microbials like Saprolegnia and methanogenic bacterias (SRB - sulfate reduction bacterias).
Track sudden changes in microbial stability
Connect with relevant water quality parameters and fish health diagnostic tools.
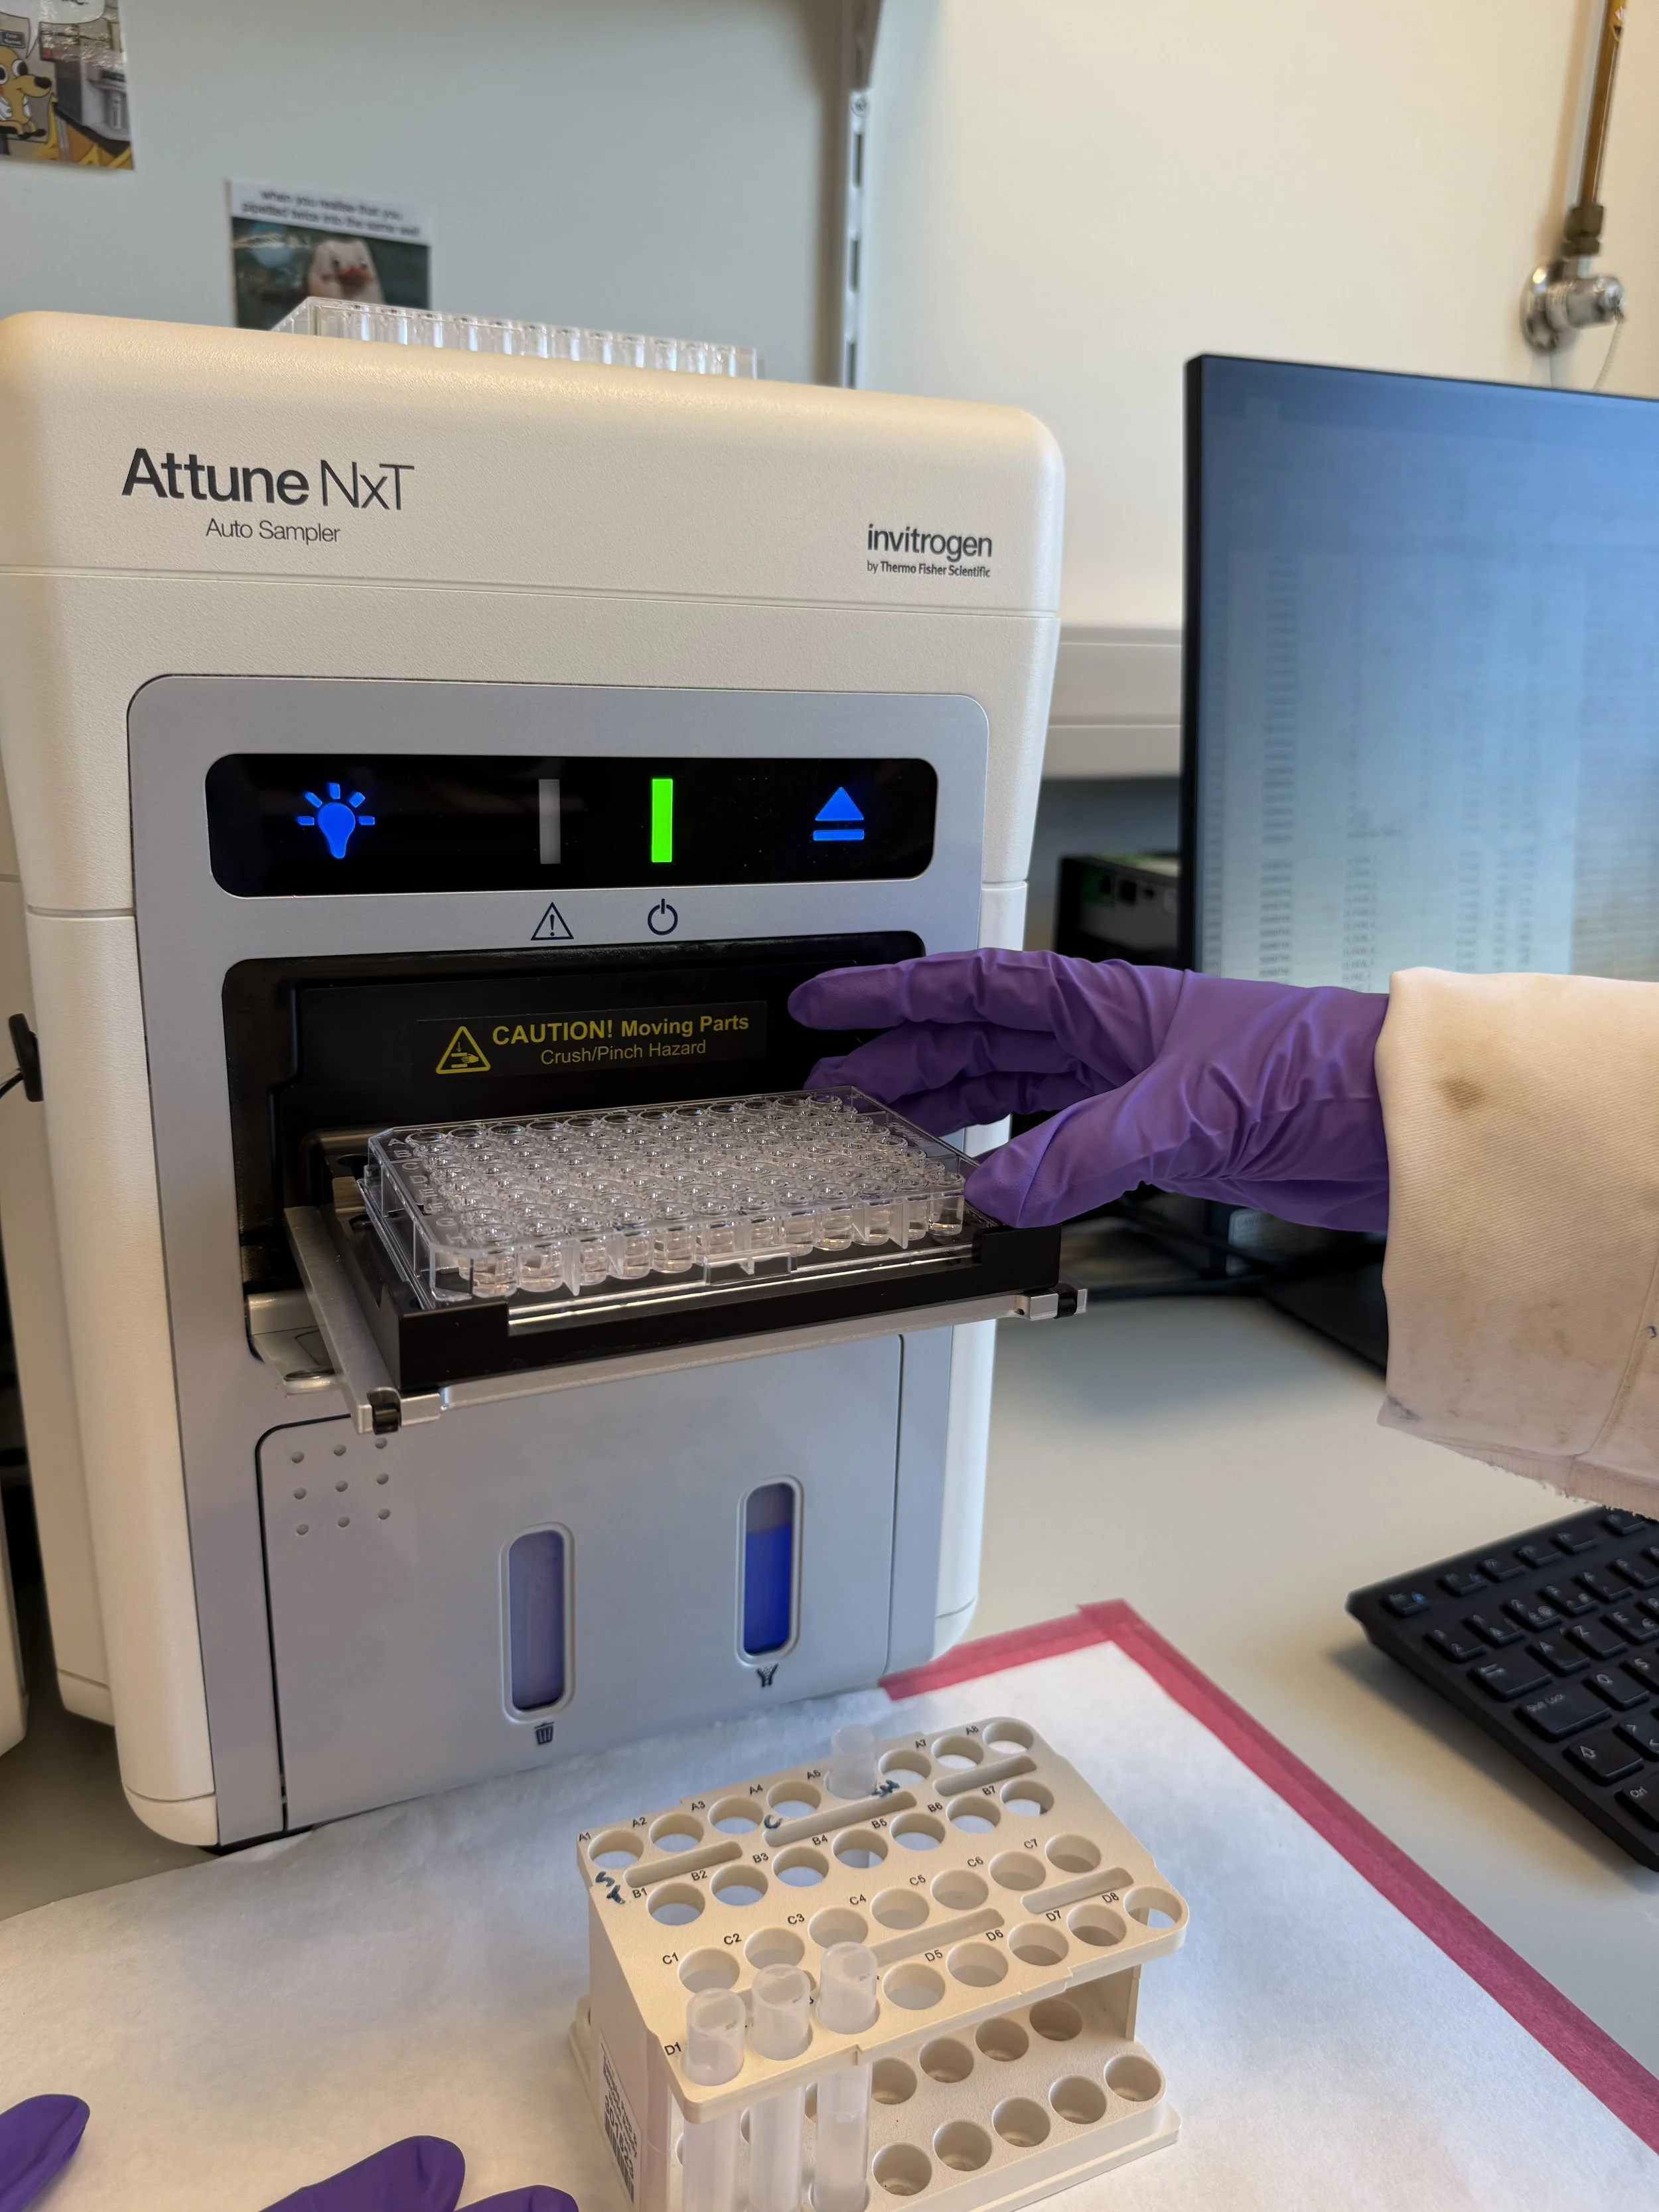
Kytos technology is based on flow cytometry, a technology that is robust and fast. The water sample is taken from the fish tank or the biofilter and sent to the local lab. In few minutes hundreds of thousands of microbes are scanned by a laser beam and data is sorted and uploaded to your app.
The microbiology content (or microbiome) contains numerous species and by using different protocols, Kytos can determine whether it is bacteria, fungi (Saprolegnia), microalgae and others, just by taking this one water sample.
The product
-
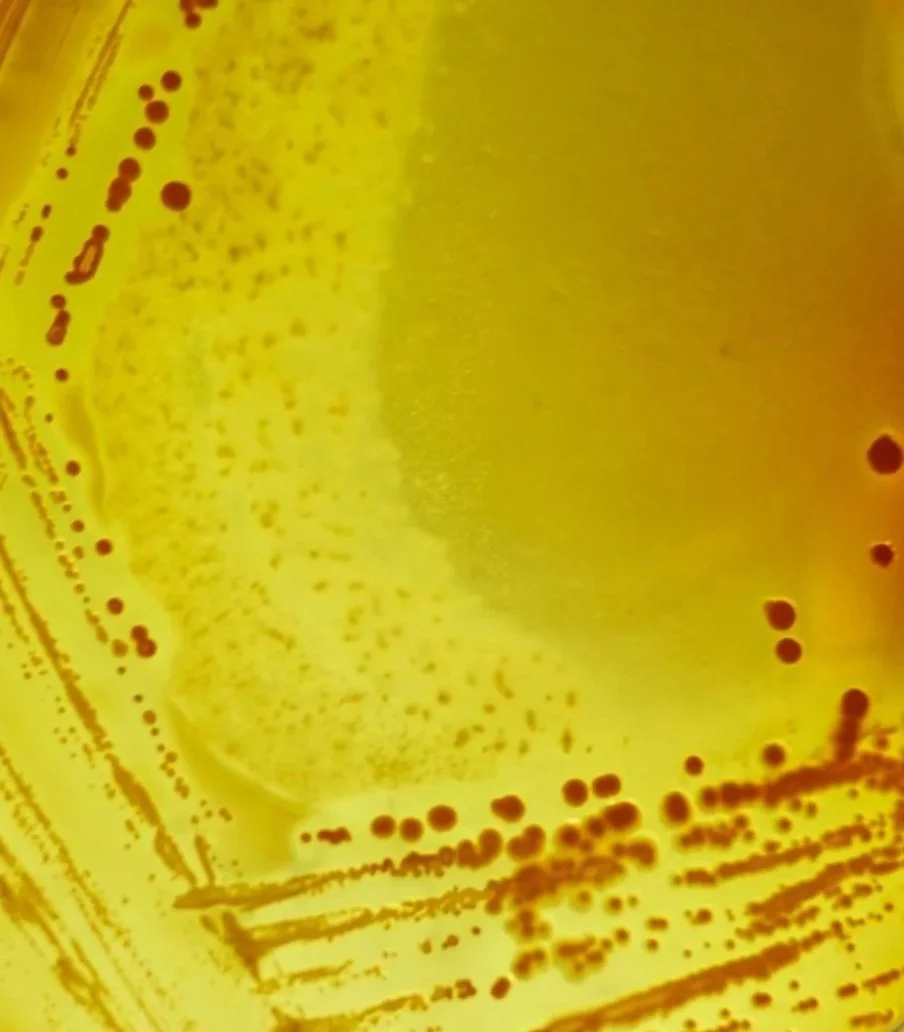
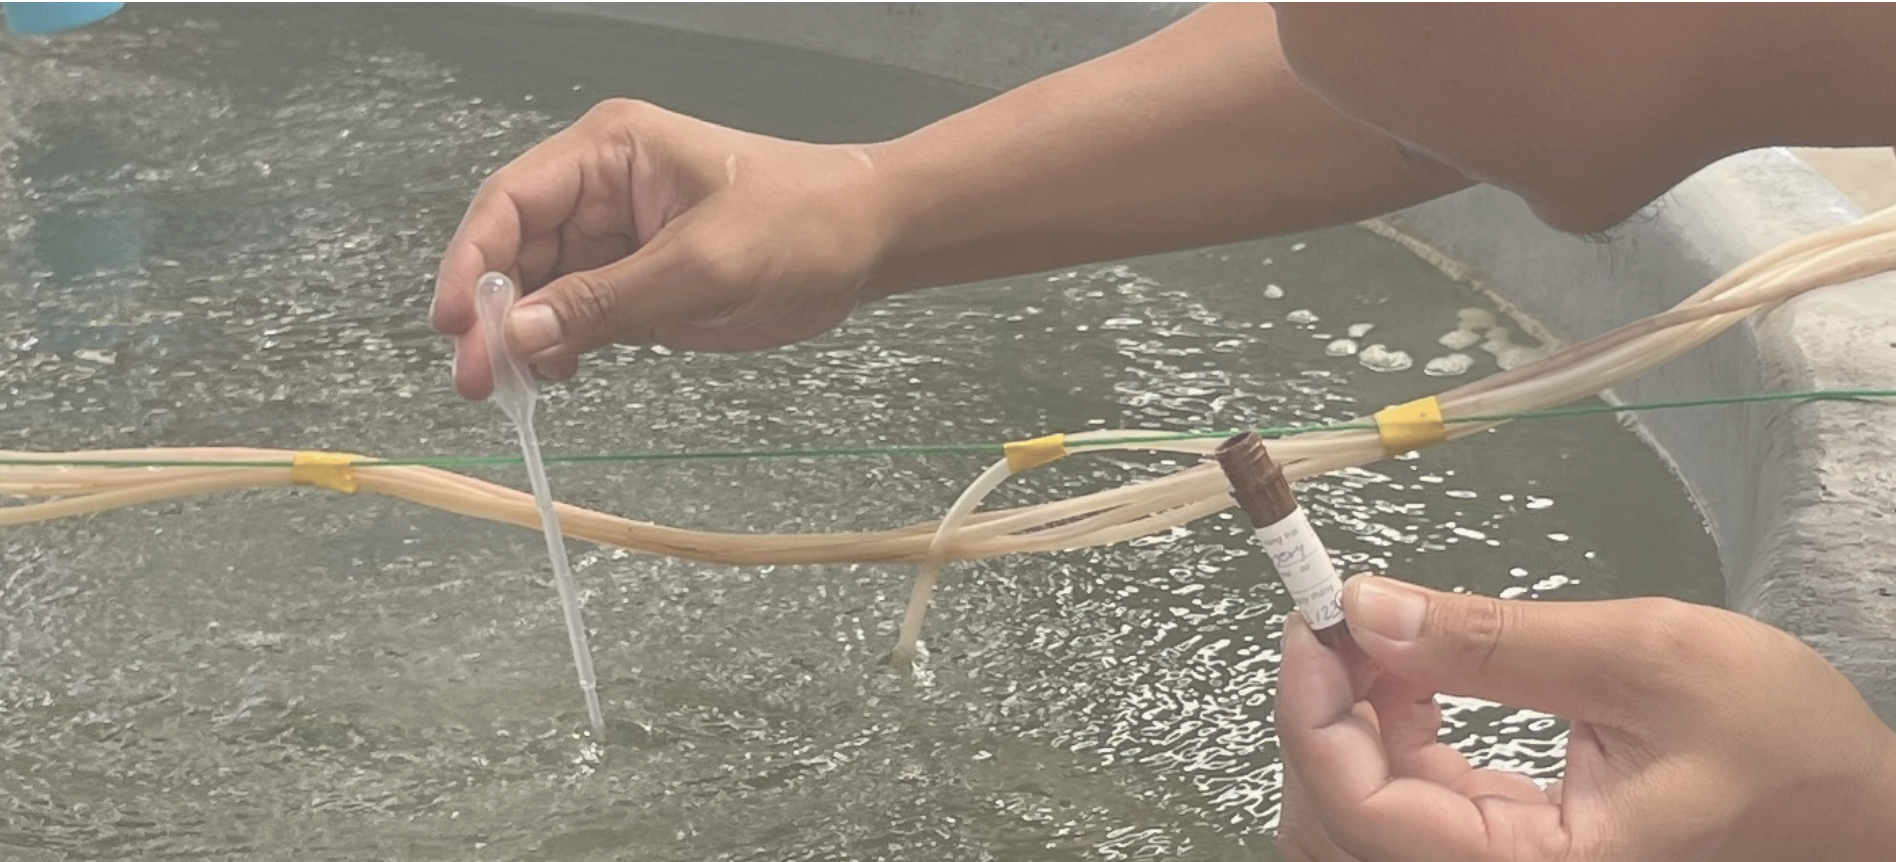
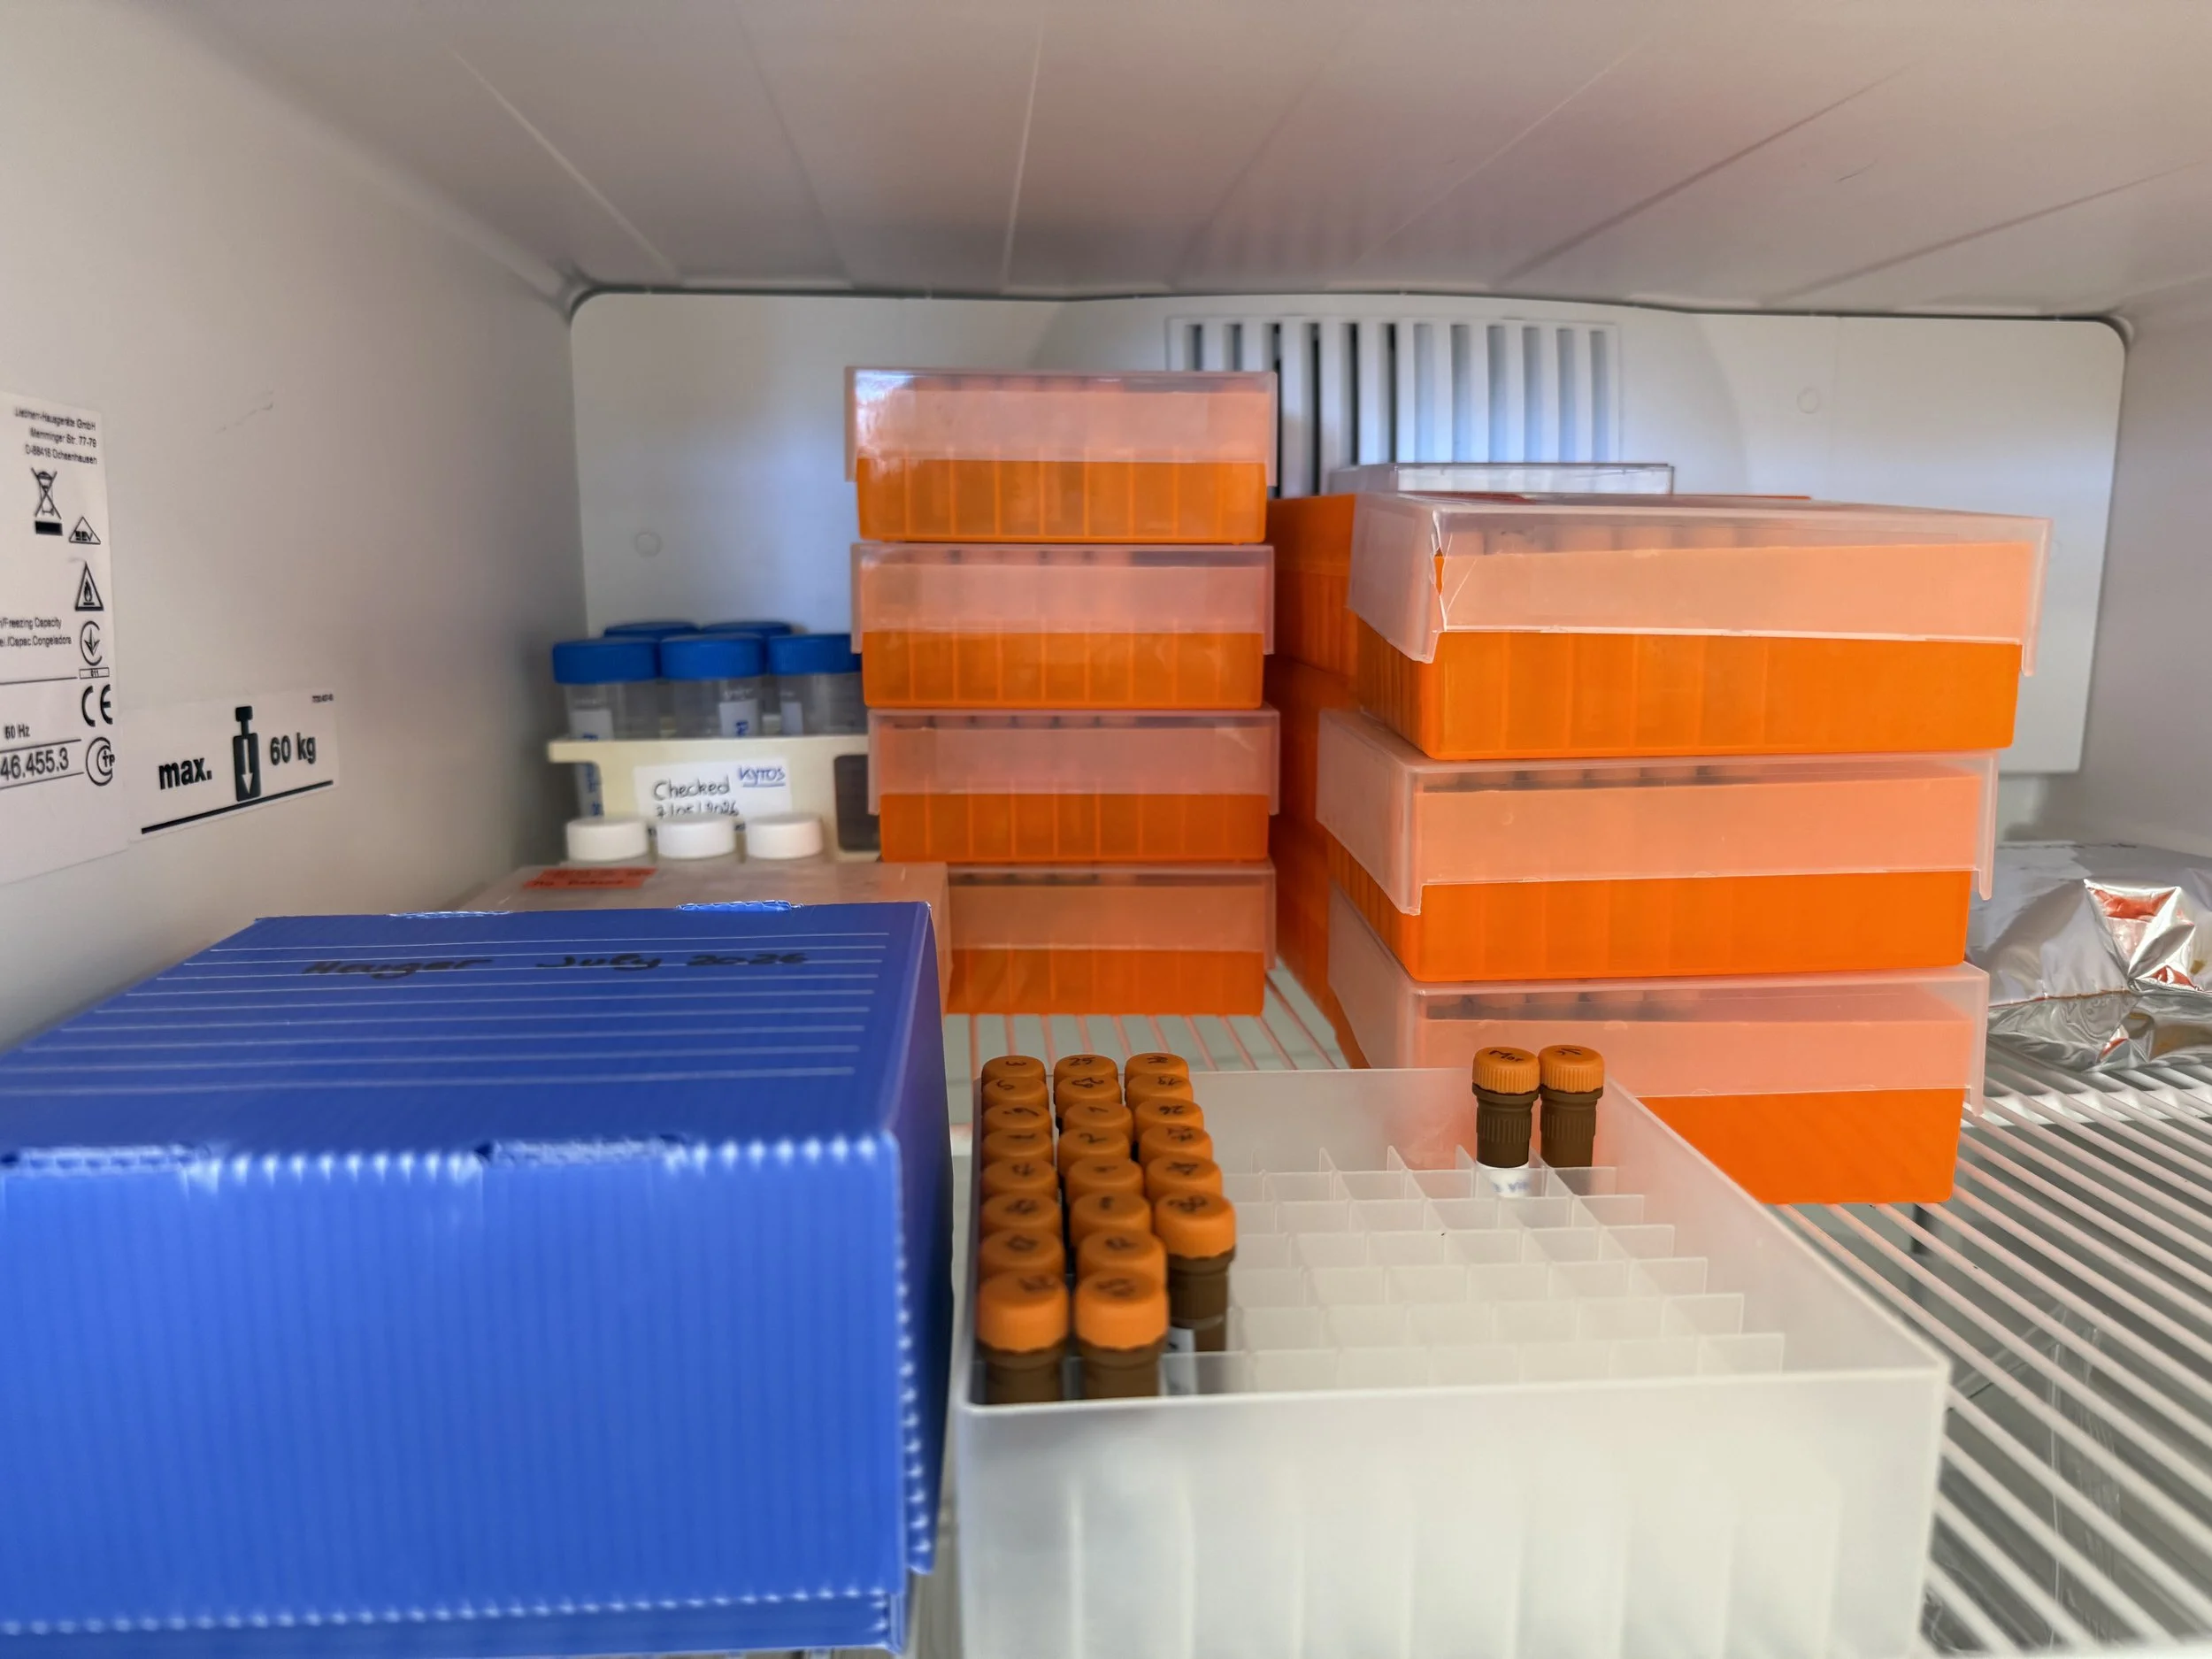
The sampling are easily performed by taking one water sample or other material (tissue, gut, sediment). The samples are kept in small tubes (Kytos Vial), containing a bactericidal component that kills bacterial activity but preserves the bacterial genome (DNA).
Samples can be stored in the fridge for 6 months before analysis, meaning that you don’t activate the cost of analysis until it’s necessary.
The samples are analysed by using flow cytometry. Before analysis the samples are crushed.
-
Explore our ever-growing list of microbial health indicators
Connect your farm management to microbial health
Evaluate your microbial risks via our identification algorithms
Manage your health situation via our product applications
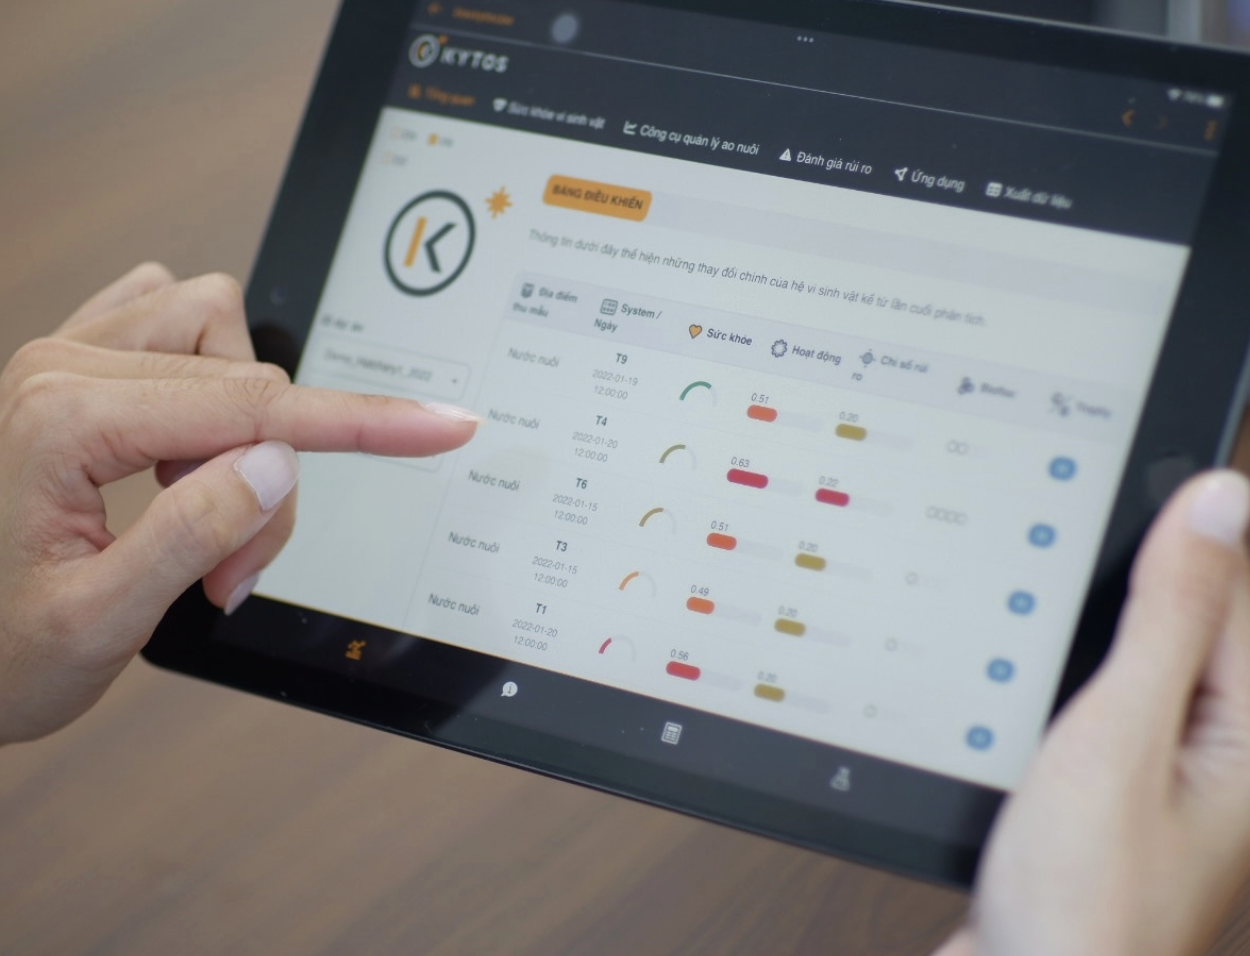
SmartAkva offers full subscription to KytosApp and web application, enabling you to monitor the microbial health situation on a daily basis.
KytoApp is secure, available 24/7, and shows you the data you need to make a decision.
For further insight the Kytos platform grants you easy access to detailed views on all the indicators so you can get the most out of your data.
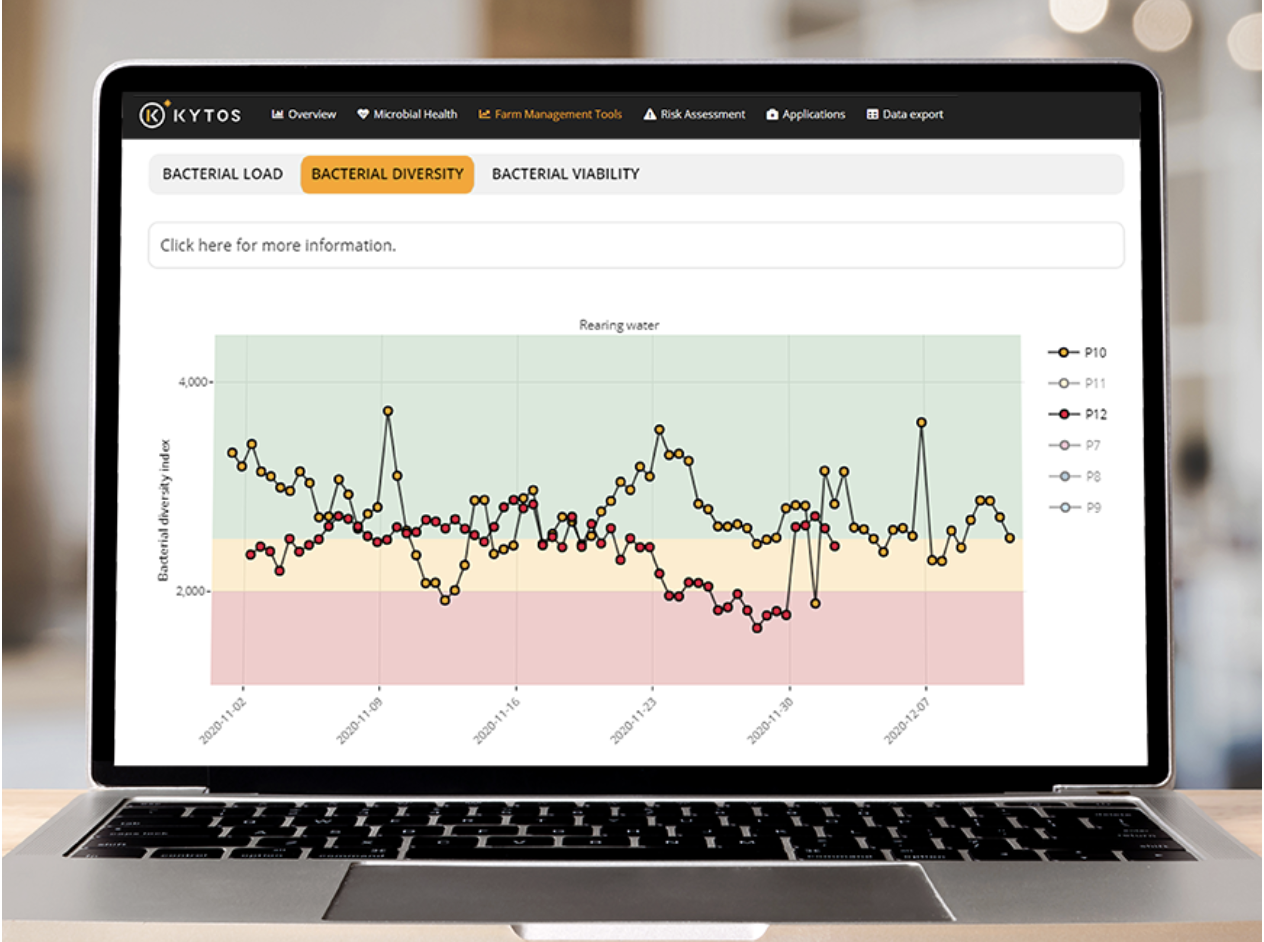
One-click navigation to the desired tab in the application: Microbial health, Farm Management, Risk Management or Product Application tab.
Easily interpret the trends by following the red, orange and green health boundaries.
Interact with each figure by selecting ponds, downloading graphs, and zooming in on the region-of-interest.
Software as a service
In the subscription a weekly meeting with our microbial expert Ingrid can be assessed.
From Sample to Insight
Your microbial health assessment is in safe hands. We ensure quality measurements and interpretations from sample collection all the way to data interpretation.